Because we can't get enough! And because reason #1 was reason alone to make another list. Make sure you read the first 40 Reasons, of course.
Monday, May 27, 2013
Friday, May 24, 2013
Bruins YouTube: Bear Hockey Rules, History Will Be Made
Bruins Hockey Rules:
- Winter Classic jerseys
- Hibernation always ends in October
- Hang up the phone
- Never tuck in your jersey
- Never date within the division
- Christmas gifts
- Bellyfat
- Always have your victory dance ready
- Never leave early to avoid traffic
- Bear Hunter
- Never disrespect the Garden
- Never disrespect the jersey
- Seat upgrade
- Obey restroom code
- The Bear's Cup
The Bear & The Gang:
History Will Be Made from 2011:
- Bobby Orr: What if Bobby Didn't Fly?
- 4/23/11: History happens in Double OT
- 5/2/11: History doesn't let up
- 5/6/11: History doesn't let history repeat
- 5/17/11: History doesn't act it's age
- 5/19/11: History ets nothing by
- 5/23/11: History doesn't back down
- 5/27/11: History awaits.
- 6/6/11: History makes a statement
- 6/13/11: History works fast.
- 6/15/11: History returns to Boston.
Monday, May 20, 2013
AHL President is pissed NBC refuses to acknowledge the AHL
Edit: read a much cleaner version of this on a much more stable website on Stanley Cup of Chowder here (published as as of 10 am Monday morning)
 |
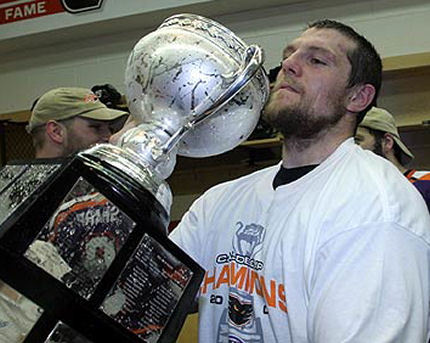
| Dennis Seidenberg: learned to be a champion in PHILADELPHIA. |
The AHL President Rants on Twitter
On Sunday evening after the broadcast of the Bruins/Rangers game, the president of the American Hockey League (AHL) went on a mini-rant on twitter that was totally legit. What sparked the tweets was basically the fact that one of the biggest story lines of this series so far is the rookie defensemen filling in on the Bruins blueline - Krug, Bartkowski, and Hamilton - and how two of those three rookies came straight from the AHL and their immediate success in the NHL playoffs can be directly attributed to the AHL.
Sunday, May 19, 2013
40 Reasons to Love Tuukka Rask (in case you don't already love him!)
Friday, March 22, 2013
5v5 Plus-Minus per Game & PDO: 3/22/13
Using statistics from the great Behind The Net, a quick comparison of where a team ranks in the statistic of 5-on-5 goal differential per 60 minutes and where a team ranks in the league standings in terms of points shows that it is pretty accurate.
The Bruins rank 5th in the league in points, and are 5th in the league in this particular stat as well.
Interestingly, the 3 teams with the biggest variation in 5v5 rank and points rank are all southeast division teams: Carolina, Washington, and Tampa Bay - all who have a relatively high 5v5 rank, but are very low in actual points rank.
Sunday, February 24, 2013
NHL Realignment 2.0
This post from December 2011 shows the previous proposed realignment. Here is the new proposed realignment:
Monday, February 4, 2013
Boston Bruins Player Usage Charts Through 8 Games
Rob Vollman of Hockey Prospectus creates these amazing Player Usage Charts. Here are the Bruins stats through the first 8 games of this season:
Player Usage Charts are pretty excellent. Their purpose, in his own words:
When looking at the chart above, you can see (as the quote says) a Horizontal Axis representing Offensive Zone Starts in percentages.
 |
| Click for full size |
[To] show how players are used and how they performed at even-strength by mapping the percentage of shifts they started in the offensive zone (horizontal axis) against the average quality of their competition, as measured in attempted shots (vertical axis), with sized and coloured bubbles denoting how well the team performed with them on the ice relative to everyone else.This handy attachment includes in-depth explanation of how these graphs are put together and how to read them correctly, as well as analysis of last seasons numbers on a team-by-team basis.
When looking at the chart above, you can see (as the quote says) a Horizontal Axis representing Offensive Zone Starts in percentages.
Offensive zone starts is the percentage of all non-neutral shifts started in the offensive zone. A common misconception is that it's the percentage of all shifts started in the offensive zone, but it ignores those in the neutral zone and is therefore perhaps poorly named (like most hockey statistics). Think of it more as a representation of whether a player is used primarily for his offensive talents, or defensive.The Vertical Axis shows the Quality of Competition numbers (look at the raw data here at Behind the Net):
Quality of Competition is the average plus/minus of one's opponents over 60 minutes, except that it is based on attempted-shots (Corsi) instead of goals. In this particular variation we are using Relative Corsi (explained below). Players who face top lines will have high QoC's while those with the easier task of facing mostly depth lines will have negative QoCs.
What is Relative Corsi (The Bubbles)?
Corsi, another poorly named statistic, is simply a player's plus/minus, except that it's measured in attempted shots instead of goals. In this case it's calculated over 60 minutes, and Relative Corsi is calculated relative to how the team did without him.Again, you find all this info and more here.
Subscribe to:
Posts (Atom)
![IT'S A [neutral zone] TRAP!](https://blogger.googleusercontent.com/img/b/R29vZ2xl/AVvXsEh6FPi4KmxO4RfeaS9RKKjdvboJixn2IY45Jftw8vA7Hb2kCqWY9nPt3RVpy1LEcodm1YtxujkfpFmG3w53e4hPXUxwc9hicEFFmNz3KqN6yzqB_pPlTk8uGtwvknxJaBqyQQhElLOuwYWi/s1600/000000.jpg)


